다음과 같은 다항식이 있을 때
$$ f(x, y)=x^2+2 x y+y^2 $$
Gradient 벡터는 각 항에 대한 편미분을 원소로 갖는 벡터의 형태를 가진다.
$$ \nabla f(x, y)=\frac{\partial f(x, y)}{\partial x} \vec{i}+\frac{\partial f(x, y)}{\partial y} \vec{\jmath} $$
여기서 𝑖 는 x축, 𝑗 는 y축에 대한 단위벡터이다.
이 Gradient 벡터는 어느 지점에서의 기울기를 나타내는 벡터이며,
$ f(x, y) $ 의 특정 지점에서 기울기가 가장 가파른 곳으로 향하는 벡터이다.
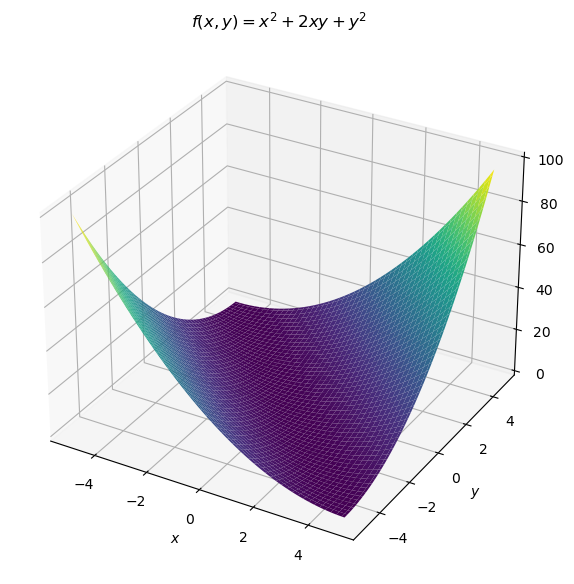
그래프로 확인해보면 아래와 같다.
먼저 $ f(x, y) $를 확인해보자.
수식적인 표현이 아니더라도 $ f(x, y) $ 그래프를 보았을 때,
(0,0) 지점에서는 완만한 형태를 보이다가 (x, y)가 커질 수록 평면의 기울기가 가팔라지는 것을 확인할 수 있다.

더보기
import numpy as np
import matplotlib.pyplot as plt

x = np.arange(-10, 10, 0.1)
y = np.arange(-10, 10, 0.1)
x, y = np.meshgrid(x, y)
z = x**2 + 2*x*y + y**2

fig = plt.figure(figsize=(7, 7))
ax = fig.add_subplot(111, projection="3d")
ax.plot_surface(x, y, z, cmap="viridis")
plt.xlabel('$x$')
plt.ylabel('$y$')
plt.title('$f(x, y) = x^2 + 2xy + y^2$')
이에 대한 Gradient 벡터 필드는 아래와 같이 표현될 수 있으며 위 그래프의 기울기 형태를 따라가는 것을 확인할 수 있다.

더보기
import numpy as np
import matplotlib.pyplot as plt

# Define the grid of points
x, y = np.meshgrid(np.linspace(-5, 5, 20), np.linspace(-5, 5, 20))

# Compute the gradient components
u = 2*x + 2*y  # ∂f/∂x
v = 2*x + 2*y  # ∂f/∂y

# Plot the function's gradient vector field
plt.figure(figsize=(8, 6))
plt.quiver(x, y, u, v, color='red')

plt.xlim([-5, 5])
plt.ylim([-5, 5])
plt.xlabel('$x$')
plt.ylabel('$y$')
plt.title('Gradient Vector Field of $f(x, y) = x^2 + 2xy + y^2$')
plt.axhline(0, color='black',linewidth=0.5)
plt.axvline(0, color='black',linewidth=0.5)
plt.grid(True, which='both', linestyle='--', linewidth=0.5)
plt.show()
(입체적으로 Gradient 벡터에 대해 보고 싶다면 이 포스팅을 확인하길 바란다.)
참고
- https://angeloyeo.github.io/2019/08/25/gradient.html
- https://jebae.github.io/gradient-vector
- https://www.youtube.com/watch?v=nma8R7sMuv0
'Machine Learning' 카테고리의 다른 글
| ROC Curve (0) | 2024.05.23 |
|---|---|
| Classification task에서 Cross-Entropy (0) | 2024.05.18 |
| L1, L2 Regularization (0) | 2024.05.07 |
| Feature scaling 과 머신러닝 학습 (0) | 2024.04.26 |
| Gradient Descent (0) | 2024.03.03 |


댓글